Breathing City
Air is invisible, but cities breathe. Real-time air quality data from 12 global cities drives twelve thousand particles — emerald and free-floating when air is clean, dark red and suffocating when polluted. Every city switch is a deep breath across latitudes.
About This Work
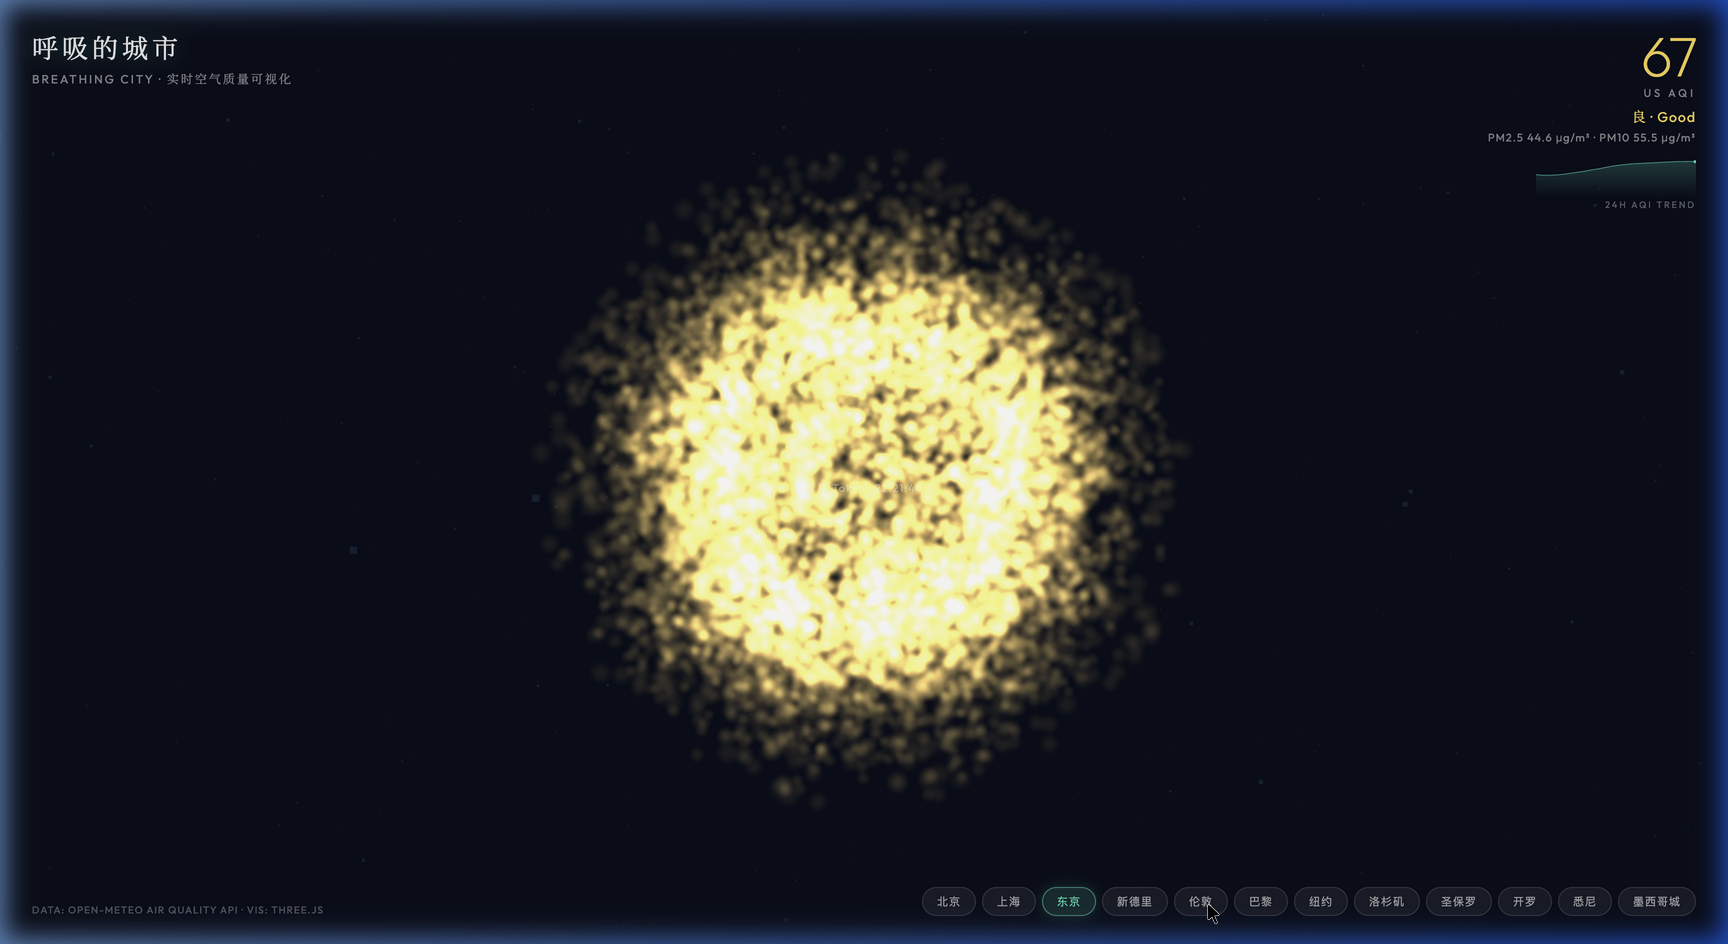
We inhale twelve thousand liters of air daily, yet never see its color. Breathing City translates real-time Air Quality Index (AQI) from 12 global cities into an organism of twelve thousand particles. When air is excellent (AQI ≤ 50), particles are sparse and large — emerald-green points float freely on a spherical shell with slow, deep breathing. When air deteriorates (AQI > 200), particles shrink, cluster densely, and dark-red dust struggles in constricted space with rapid, heavy breathing. Color, size, density, radius, and breathing rate are all driven by real-time US AQI from Open-Meteo. City transitions smoothly interpolate all parameters (LERP), creating a visual breath across latitudes. The data panel shows current AQI, PM2.5/PM10 concentrations, and a 24-hour trend sparkline.
Features
- Open-Meteo real-time air quality data (12 global cities, auto-refresh every 10 min)
- 12,000 particle GLSL shader breathing animation (shell distribution + Perlin Noise)
- AQI → 5-level visual mapping (color/size/density/radius/breath rate)
- Smooth city transition animation (LERP interpolation)
- 24-hour AQI trend sparkline (Canvas)
- OrbitControls free 3D rotation
- Ambient dust particle background layer
- Data caching to avoid redundant requests
How to Use
- Real-time Beijing air quality data loads automatically
- Bottom city buttons switch between 12 global cities
- Observe particle color and density changes to feel air quality differences
- Drag to rotate 3D view, scroll to zoom
- Top-right panel shows AQI value, PM2.5/PM10 concentrations
- 24H AQI TREND sparkline shows daily air quality changes